Hello
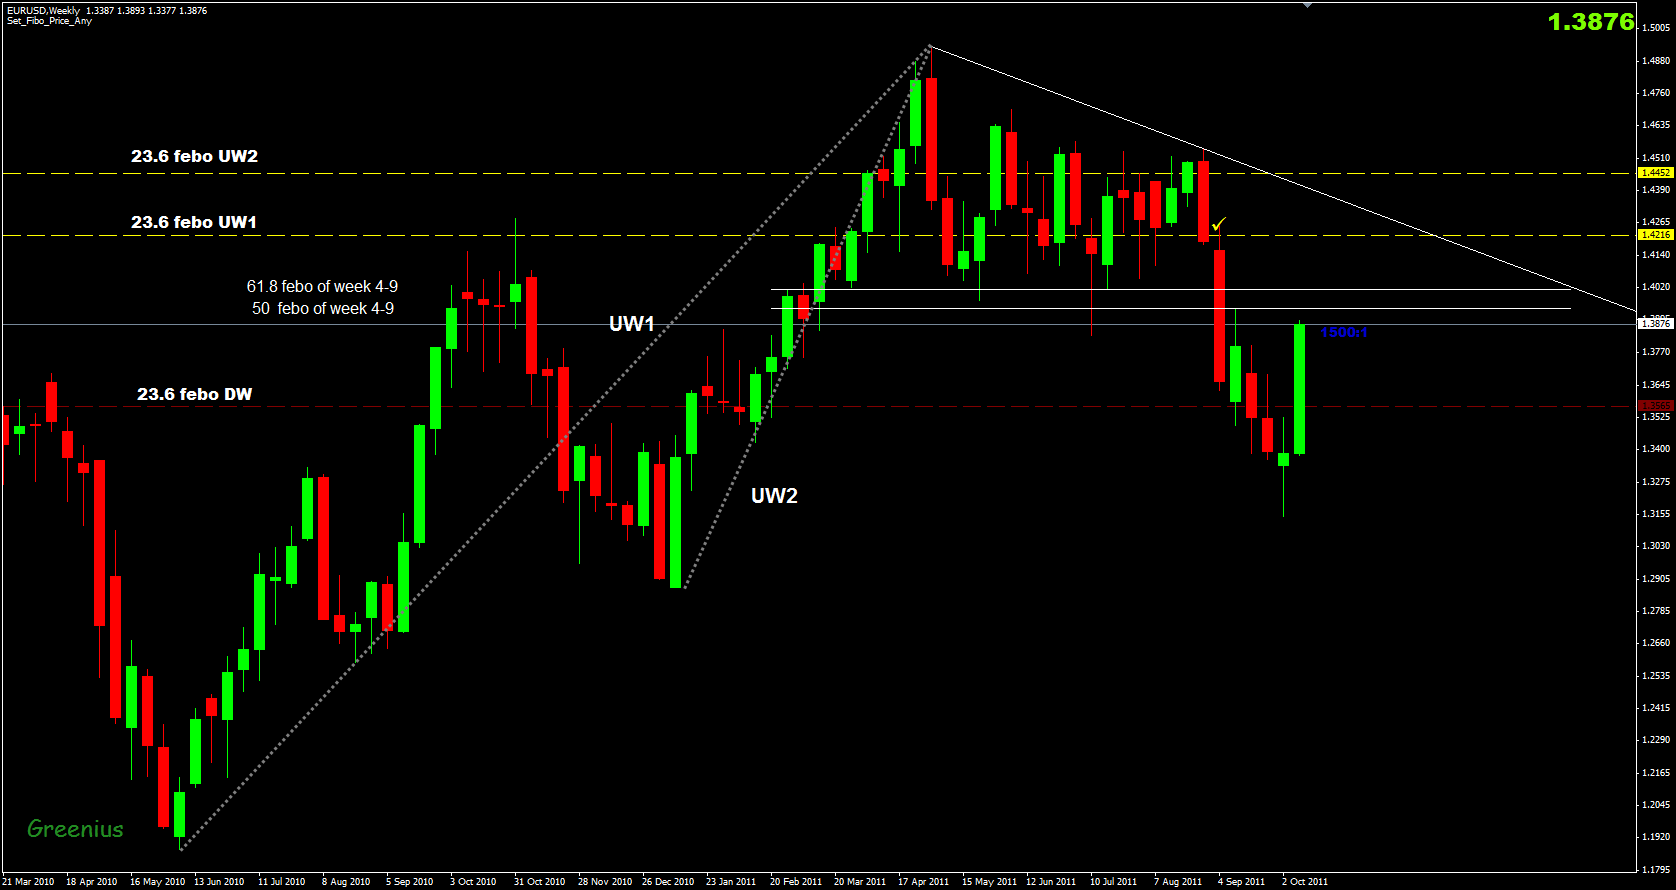
let start from EURUSD from weekly chart and to draw 23.6 febo of wave 1 &2 and down wave also
and i select weekly bar 4-9-2011 and draw 50 & 61 febo of this week please see chart one
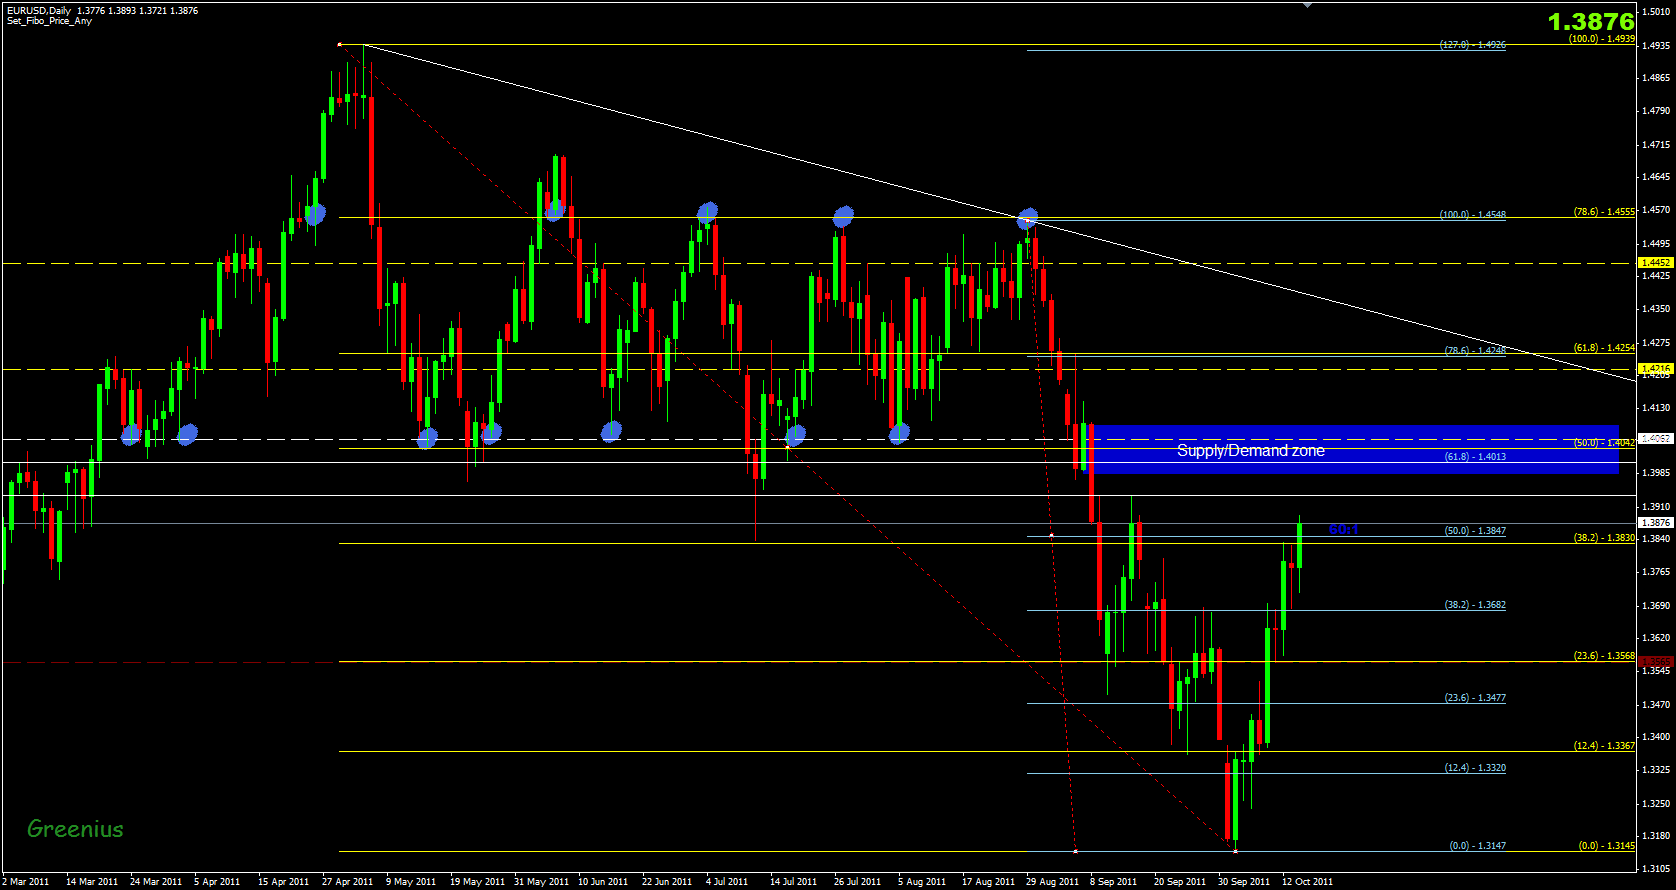
in daily chart we find supply and demand zone with round number 14000 and 61.8 febo from last drop with 50 febo from all drop intonational PZ 14062 from 7 point price retested
the zone between 1.398 to 1.4092 will be strong turning point to EURUSD